A minor issue in the regulation of Canadian patent and trademark agents is the current licence numbers do not reflect the seniority of the practitioners. I built a proxy system where you can estimate your seniority as a patent agent. As well, this is an example of where our profession needs people analytics.
The problem
Recently, I shared some issues with the registration of patent agents with the College of Patent Agents and Trademark Agents. CPATA is so on top of these matters, I had to revise my post because first their monthly newsletter arrived addressing one issue, and then the CEO wrote me to shed insights on other issues.
Darrel Pink, CEO of CPATA, explained that while there were some attachments to the old numbers they were not usable. No kidding. my number was all ones and sevens – so cool. Not all numbers encoded seniority and there were other issues. Mr. Pink is moving on, and he deserves a lot of praise for taking on the challenge of leading CPATA as it got started.
CPATA does list the first date of licensing for agents. However, this information is not available without some invasive web scraping. So, rather than bring down a website I looked for an alternative data source.
Often in data science, you need to use a second data source. But it is generally not done in people analytics without a shared key to join the datasets. However, since we are just going to be sampling, I didn’t worry about doing a strong join.
American data as a proxy
I looked at the USPTO data for Canadian agents. I downloaded the roster on 2022 December 12. This was current to 2022 December 9.
Basic demographics of patent agents
Of 49,960 agents and attorneys listed at the USPTO, 97% are US residents. Just 1.7% are in Canada. The rest are about 50 other countries. So, 857 people have an address in Canada. About 27 are an “attorney” meaning they are likely an American citizen living in Canada.
There are about 830 agents with reciprocal recognition. Considering there are 920 patent agents in Canada most of us are also US patent agents. Thus, this is likely good proxy data.
Most of the patent agents are in four provinces. About 98% are in Ontario, Quebec, B.C., and Alberta. Over 60% are in Ontario and just 6% in Alberta.
Cleaning the data
The data is dirty. Per the OED, the dean of our profession was admitted to the USPTO bar in 1957 with a registration number near 19,000. No need to share exact names and numbers. This person would be at least 87 and is not listed with CPATA. So, I cross-referenced with Canadian sources to remove any inactive members in the top 20 practitioners. I deleted about 10 names, including one of my tutors E. Peter Johnson who had practiced for over 50 years.
Results
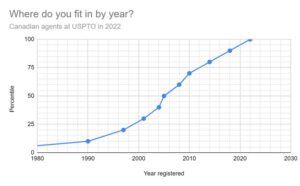
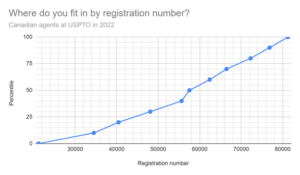
Our most senior practitioner was admitted to the USPTO in 1964 with a registration number near 21,000. The youngest member joined in 2022 and has a number near 81,000. The median is 2005 and 58,000.
If you were admitted to the USPTO you can see where you stand in the profession by decile. That is, you can look up your standing to a resolution of ten percent by your registration number or the year admitted.
| Year | Reg No | Percentile |
| 1964 | 21,000 | 0 |
| 1990 | 35,000 | 10 |
| 1997 | 40,000 | 20 |
| 2001 | 48,000 | 30 |
| 2004 | 56,000 | 40 |
| 2005 | 58,000 | 50 |
| 2008 | 62,000 | 60 |
| 2010 | 66,000 | 70 |
| 2014 | 72,000 | 80 |
| 2018 | 77,000 | 90 |
| 2022 | 81,000 | 100 |
Find your seniority as a patent agent
The first table is useful for seeing where the deciles fall. I created some interpolation tables by year and registration number.
| Year | Estimated Percentile |
| 1965 | 0 |
| 1970 | 2 |
| 1975 | 4 |
| 1980 | 6 |
| 1985 | 8 |
| 1990 | 10 |
| 1995 | 17 |
| 2000 | 24 |
| 2005 | 47 |
| 2010 | 70 |
| 2015 | 83 |
| 2020 | 95 |
| Reg. No. | Estimated Percentile |
| 30,000 | 8 |
| 35,000 | 13 |
| 40,000 | 19 |
| 45,000 | 26 |
| 50,000 | 33 |
| 55,000 | 36 |
| 60,000 | 55 |
| 65,000 | 66 |
| 70,000 | 76 |
| 75,000 | 86 |
| 80,000 | 97 |
You can also plot this data. However, images on our blog site are not working well. If you want charts email me at I will gladly share: miles at perpetual patents dot com The images show:
- This is a line plot of percentile against registration year. You can see where the deciles fall or using the bottom axis estimate your seniority of Canadian agents at USPTO.
- This is a line plot of percentile against registration number.
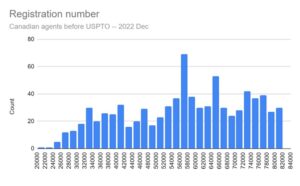
- A histogram of registration numbers. There is a clear peak corresponding to numbers assigned between 2004 April and 2005 December.


In terms of summary statistics we are as boring as the public thinks we are. Even the mean, mode, and median agree.
| Statistic | Value |
| Mean | 56900 |
| Mode | 56000 – 58000 |
| Median | 57500 |
| Range | 50200 |
| Standard Deviation | 15200 |
Discussion
Claiming seniority is basically data-driven puffery. But if you are curious these tables provide a good approximation with two caveats. One, not every Canadian patent agent is admitted to the USPTO. Still most are. It is hoped that these practitioners are evenly distributed by seniority. Two, there are three delays between when someone starts to practice and their admission to the USPTO bar – qualifying to write the exam, passing the exam, and applying to the USPTO.
Call for more people analytics
We need better people analytics on our profession. The public and the regulator needs to understand basic demographics like: age, location, size, and tenure. The regulator needs to project income. The profession and the regulator should quantify access to agents. For example, there is one for 6,900 people in the U.S. In Canada it is one agent per 38,000. These examples are just a small illustration where people analytics can help.


